
Abstract
We present a comprehensive study of phase curves and secondary eclipses in the Kepler data set using all data from 16 quarters that were available in 2013–2014. Our sample consists of 20 confirmed planets with Rp > 4 Re, P < 10 d, Vmag < 15. Here we derive their temperatures and albedos, with an eye toward constraining models for the formation and evolution of such planets. Where there was overlap our results confirm parameters derived by previous studies, whereas we present new results for Kepler 1b-8b, 12b-15b, 17b, 40b, 41b, 43b, 44b, 76b, 77b, and 412b derived in a consistent manner. We also present light-curve analyses for Kepler 91b and Kepler 74b, which both show extra dimmings at times other than from the expected primary and secondary eclipses. Corrected for thermal emission, we find most of the massive planets from our sample to be low in albedo (< 0.1) with a few having higher albedo (>0.1).
1. Introduction
1.1. The Kepler Mission
Studying extrasolar planets is one of the major frontiers of astronomy today. The field has transformed from simple identification to comprehensive categorization and characterization of exoplanets and exoplanetary systems. Analyses of data provided by NASA’s Kepler mission have revolutionized this field by compiling a statistically significant number of transiting planets and planetary candidates (e.g., Borucki et al. 2010b; Borucki et al. 2011; Batalha et al. 2013; Burke et al. 2014; Rowe et al. 2015; Mullally et al. 2015). 1
For example, Kepler data allowed researchers to discover Kepler 9b (Holman et al. 2010), the first multiplanetary system outside our solar system; Kepler 10b (Batalha et al. 2011), one of the first confirmed rocky planets outside the solar system; and Kepler 16b (Doyle et al. 2011), the first circumbinary planet. More recently, the Kepler team announced the discovery of potentially habitable worlds in the Kepler 62 (Borucki et al. 2013) and Kepler 69 (Barclay et al. 2013) systems, and the near-Earth-sized planets Kepler-186f (Quintana et al. 2014) and Kepler-452b (Jenkins et al. 2015) in the habitable zones of their parent stars.
Deeper analyses are possible using the exquisite Kepler data beyond merely detecting exoplanetary systems: researchers are now able to analyze large samples of planetary candidates to pin down occurrence rates such as ηearth (e.g., Howard et al. 2012; Dressing & Charbonneau 2013; Fressin et al. 2013; Petigura et al. 2013; Burke et al. 2015), find nontransiting planets via transit timing variations (Ballard et al. 2011), perform phase-curve analyses (Faigler et al. 2013), and may eventually even be able to detect exomoons (Kipping et al. 2013) and exotrojans (Hippke & Angerhausen 2015a).
For the close-in, and therefore hot, planets around bright, high-signal host stars in the Kepler data set, we are able to analyze secondary eclipses, i.e., the modulated flux from the star-planet system when the light (reflection and thermal emission) of the planet disappears during its passage behind the parent star. Differential measurements then help us to characterize physical parameters of the planet such as albedo and temperature. Measuring such quantities, together with complementary spectroscopic measurements, can provide constraints on models for the formation and atmospheric photochemistry of such close-in planets (e.g., Line et al. 2010; Moses et al. 2011; Visscher & Moses 2011).
1.2. Transits and Eclipses
Systems with transiting extrasolar planets can offer two important observational opportunities for deriving physical parameters of the planets. In primary transit, the planet crosses the star. From a broadband transit light curve, in this case, one can measure the planetary radius Rp in units of the stellar radius R∗. The depth of the transit is (Rp /R∗)2, which for a Jupiter radius planet transiting a Sun-like star is of the order of 1% (e.g., Henry et al. 2000).
If the geometry (inclination, eccentricity) is right, the planet also disappears behind its host star in a so-called secondary eclipse. For a 2000 K hot Jupiter-size planet, the typical flux deficit during secondary eclipse is 200 ppm at 2 μm in the near-infrared and even larger at longer wavelengths, but considerably smaller at optical wavelengths (400–900 nm) at which Kepler observes. However, for host stars that are bright enough, Kepler’s outstanding sensitivity provides a direct measure of the planet’s disk-averaged dayside flux for some of its targets, particularly close-in gas giants–so-called “Hot Jupiters” and “Hot Neptunes.”
Observing secondary eclipses combined with planetary phase curves can help us to characterize the planet and its atmosphere. For example, the depth of the secondary eclipse can constrain the albedo of the planet, while the timing and width of the secondary eclipse can help determine its orbital parameters. Comparing the amplitude of the reflected light in the phase curve with the depth of the secondary eclipse can constrain the day and nightside temperatures, and therefore confirm the planetary nature of a candidate that is not self-luminous, and help to understand day to nightside heat exchange. Measuring exoplanet eclipses, phase curves, and albedo values yield information about the composition of their atmosphere, and dayside to nightside temperature ratios yield the efficiency of energy transport and presence of possible temperature inversions (for details see, e.g., Cowan & Agol [2011]).
Several previous studies have focused on eclipses and phase curves in the Kepler database, either on select samples of objects (e.g., Kipping & Bakos [2011] [5 objects]; Coughlin & López-Morales [2012] [76 objects]; Esteves et al. [2013] [8 objects]) or for individual planets or candidates (e.g., Mazeh et al. [2012]; Morris et al. [2013]).
In the largest sample so far, Coughlin & López-Morales (2012) modeled secondary eclipses and phase curves (only via a simple sinusoidal flux term applied to the light curves) of a uniform set of Hot Jupiter candidates from Kepler to derive albedos and thermal emission properties, and compared the results with stellar and planetary parameters. While our study is similar in scope to this study, we worked with much more data (15 quarters—as available in August 2013—of data instead of 1), a slightly bigger radius range (4 Earth radii = 0.4 Jupiter radii, instead of 0.5 Jupiter radii as a lower limit), and a longer period range (10 days instead of 5 days). Furthermore, we applied a fully physical model with all different phase-curve components. Of the Coughlin & López-Morales (2012) sample of 76 KOIs, only 55 were successfully modeled with their methods. Of these 55 systems, many still remain unconfirmed planetary candidates or turned out to be false positives (e.g., KOIs 102, 1419, 1459, 1541, 1543). 2 For the confirmed planets, there is significant overlap in our samples (KOIs 1, 2, 10, 13, 17, 18, 20, 97, 127, 128, 196, 202, 203, 204), but several planets in our study (KOIs 3, 7, 98, 135, 428 and 1658) were not covered by their analysis.
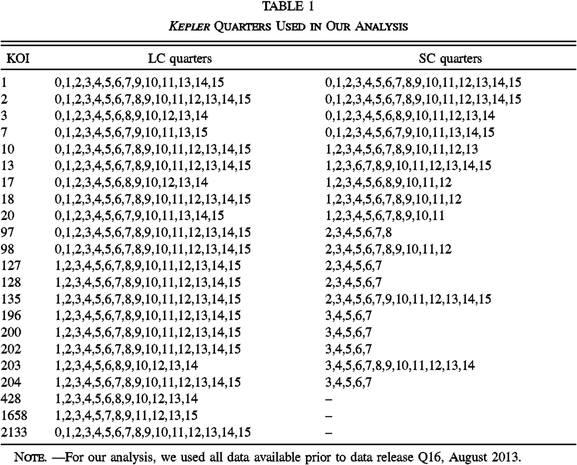
Here we present initial results of a comprehensive and consistent study of secondary eclipses and phase curves using data from quarters 0 through 15 of Kepler light curves (see Table 1), that were available at the time of our analysis. In this article, we focus on the 20 confirmed (August 2013) planets in the sample of 489 Kepler objects of interest (KOI) with Rp > 4 Re , P < 10 d, and Vmag < 15. Consistent measurements of exoplanet phase curves not only allow us to break many current degeneracies in modeling the thermal and chemical structure of separate exoplanet atmospheres, but also enable us to compare results across the whole set of analyzed systems in a comprehensive way. Analyses like this will also help us prepare for future ground- and space-based facilities that increase the number of exoplanetary systems and the wavelength range of precision observations.
|
2. Data Reduction
2.1. PyKE Data Preparation
For each of our targets, we used up to 16 quarters of the Presearch Data Conditioning Simple Aperture Photometry (PDCSAP) light curves from the Kepler database available in the Mikulski Archive for Space Telescopes (MAST) at the time of our analysis (see Table 1; prior to the release of Q16 in August 2013). The PDCSAP light curves are simple aperture photometry time series that have been cotrended in the Kepler pipeline to remove systematics common to multiple targets, using a best-fit of so-called “cotrending basis vectors” (CBVs). The CBVs are essentially the principal components of systematic artifacts for each science target and each operational quarter characterized by quantifying the features most common to hundreds of strategically selected quiet targets sampled across the detector array (see Smith et al. 2012; Stumpe et al. 2012). Short-cadence data were used in place of long-cadence data when available and both data sets were combined weighted by their errors.
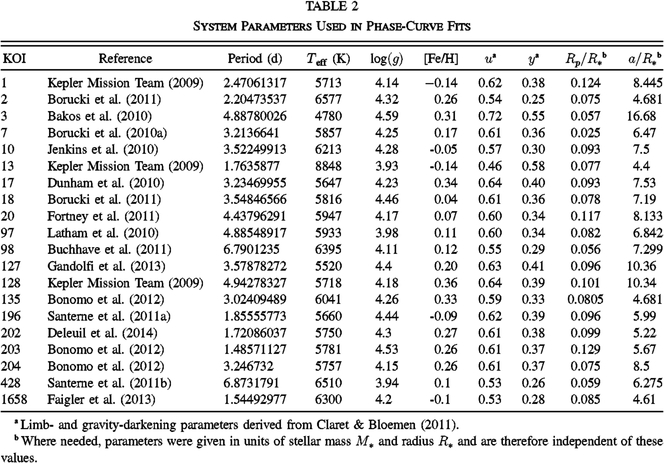
We used PyKE (Still & Barclay 2012), a series of Python-based PyRAF recipes, for the individual and target-specific analysis and reduction of Kepler time series data. Our first step was to remove long-term variability using the kepflatten task to fit a quadratic polynomial to the baseline parts of the light curve for each quarter over time intervals of seven times the length of the published orbital period of each planet (see Table 2) using a sigma clipping of 2.5. We thus minimize any contamination or overcorrection of the actual planetary phase curves by the polynomial flattening and excluded the occultations. We then concatenated these flattened curves using the kepstitch routine, which created one long time series, containing all used quarters of data (see Table 1). Finally, using the kepfold task, we folded the entire light curve by the published orbital periods of each planet to get the phase curve, that was used in the next steps of our data analysis.
|
2.2. Phase-Curve Model
We removed the primary transit signature as a first step in modeling the phase-folded light curves. The remaining normalized, out-of-transit phase curve Ftot was then modeled as
where Ftot is the sum of the stellar baseline f0 (1 for normalized data) and the following four contributions to the light curve as a function of phase ϕ, with ϕ∈[0,1], the primary transit at ϕ = 0 and the secondary eclipse around ϕ = 0.5 (for details on the various contributions see, e.g., Barclay et al. [2012], Shporer et al. [2010], or Groot [2012]):
- 1.Fe , the ellipsoidal variations resulting from tides on the star (of mass M∗ and radius R∗) raised by the planet of mass Mp and semimajor axis a described by:where f1 and f2 are:The parameter α is defined aswhere u is the linear limb-darkening parameter and y is the gravity-darkening parameter;
- 2.Fd , the Doppler boosting with amplitude Ad caused by the host star’s changing radial velocity described by:
- 3.Fp , the planet’s phase function modeled as the variation in reflected light from a Lambertian sphere (Russell 1916) described by:Here Ap is the amplitude of the planetary phase function, and z is related to phase ϕ and inclination i via:
- 4.Fecl, the secondary eclipse—i.e., the light that is blocked during the planet’s passage behind its host star—modeled using the description in Rogers et al. (2013), with r(ϕ), the separation between star and planet disk centers in the plane of the sky, in units of R∗, which we obtained from the referenced literature:where ϕm is the phase of the midpoint of the secondary eclipse.
Pecl is the eclipsed portion of the planet:
where p is and with
Here θ1 and θ2 are defined as:
Hence the contribution Fecl of the secondary eclipse with depth Decl is:
Here Decl is a positive value, with Fecl = Decl outside of secondary eclipse, such that the planet’s light is visible for most of the orbit, and then Fecl l = 0 during secondary eclipse, as the planet’s light is no longer visible.
2.3. Light-Curve Fitting
We fit the cleaned (detrended and normalized with kepflatten) and phase-folded light curves using MPFIT, an IDL package that implements Levenberg–Marquardt nonlinear least-squares curve fitting.
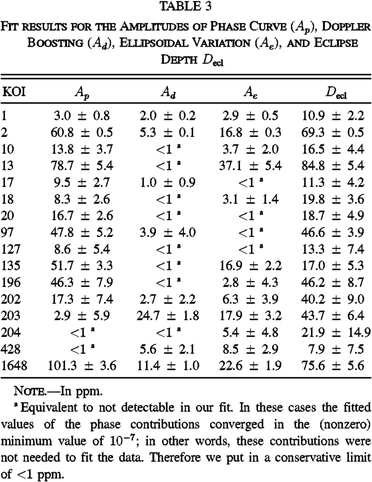
The errors on the parameters were obtained via the Levenberg–Marquardt fitting procedure, i.e., via the covariance matrix, which in some cases are likely to be underestimated as this method does not take into account parameter correlations. The period was held constant because we were fitting phase-folded data. The limb and gravity-darkening parameters were trilinearly interpolated from the tables of Claret & Bloemen (2011) and held constant during the fitting. The values for size ratio Rp /R∗ and the distance between the planet and the star a/R∗ as well as the used stellar parameters (e.g., [Fe/H] or log(g)) were obtained from the NASA Exoplanet Archive or the literature (see Table 2) and fixed in the fitting procedure. Given the short periods and tidal circularization timescales, we assumed a circular orbit for higher-order effects (e.g., of e or ω) in the contributions of the various phase-curve effects, so that they keep their analytic form. The contribution of these second-order effects is negligible and no error leakage occurred (with the exception of KOI-13, which has a significant eccentricity; see Fig. 1 and § 3.1.4). The depth of the secondary eclipse was constrained to be positive. Other parameters in the fit were the amplitude of the phase curve, the amplitude of the Doppler boosting, the amplitude of the ellipsoidal variations, the inclination, and the phase of the secondary eclipse. Restricting the depth of the secondary eclipse to be positive, along with the other fitted amplitudes, usually imparts a modeling bias toward higher positive values and more significant detections, especially if the signal is just above the noise level. Therefore, we were very critical with marginal detections and tended toward null detections if the detected number was not significantly above the error level (see also discussion below and Tables 3 and 5). For example, in certain cases, the fitted values for some of the phase contributions converged in the (nonzero) minimum value of 10-7—in other words these contributions were not needed to fit the data. In these cases, we inserted a conservative < 1 ppm in Table 3.
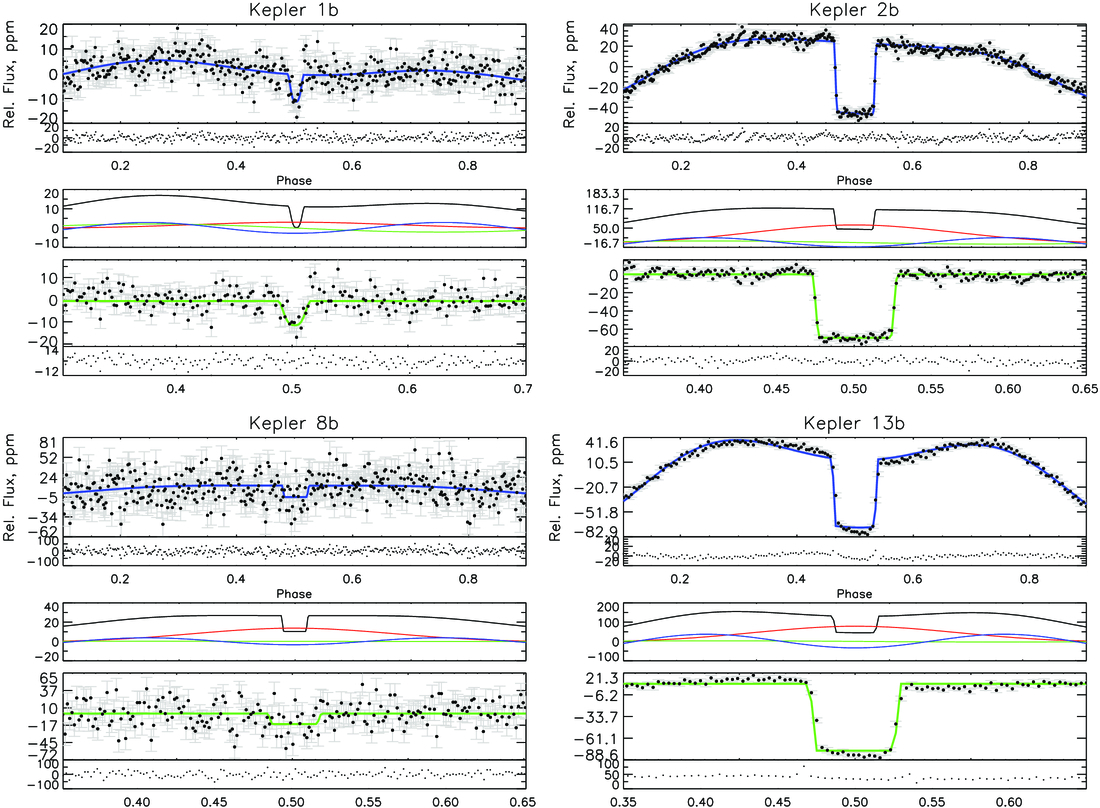
Fig. 1. Fitted light curves for KOI-1.01/TrES-2b/Kepler 1b (top left), KOI-2.01/HAT-P-7b/Kepler 2b (top right), KOI-10.01/Kepler 8b (bottom left), and KOI-13.01/Kepler 13b (bottom right). In each quarter: Phase curve, residuals (top). Center: phase-curve contributions: Doppler (blue), ellipsoidal (green), planetary phase (red). Bottom: zoom into phase curve subtracted secondary eclipse, residuals. Our model for KOI-13b shows a systematic offset from the actual data that may be explained by the system’s eccentricity (Placek et al. 2014) and/or gravity-darkening (Masuda 2015).
|
In order to work on a uniform dataset and due to the computational intensity of fitting unbinned data, we cut out the transit part and binned all folded light curves down to 400 points for phase ϕ = [0.1,0.9] (the kepfold routine used in the previous step already ensured that short- and long-cadence data were combined properly in an error-weighted way). While Kipping (2010) showed that binning can induce morphological distortions to the photometric data and light-curve data of long cadence, we argue that the phase-curve models work without a correction for this, as phase-curve durations are significantly greater than the 30-minute cadence. For the secondary eclipse depths, the integration time and binning will extend the secondary eclipse ingress and egress time, but those are very short compared to the eclipse duration.
We sought to include the best available parameters for the host stars in our modeling. Values from the Kepler Input Catalog (KIC) were often inaccurate, so we relied on the stellar parameters derived in the (mostly spectroscopic) planet confirmation observations (see Table 2) available at the time of our analysis.
2.4. Temperatures and Albedos
We calculated the brightness temperatures using:
where Decl is the depth of the secondary eclipse, Rp /R∗ is the size ratio, Bλ is the Planck function, Tb is the brightness temperature, TK is the Kepler response function, and T⋆ is the stellar temperature. To solve for Tb , we integrated the right-hand side of
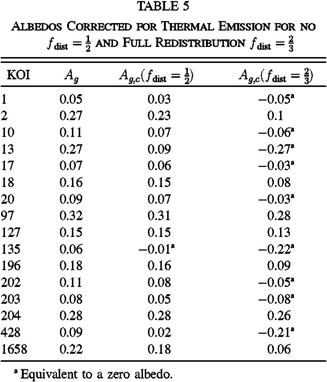
and then numerically integrated the left-hand side iteratively using successively larger temperature values, until we found the brightness temperature that best matched the measured depth of the secondary eclipse. The nightside temperatures are calculated in the same way, but using Fnight = Fecl - Ap instead. If the difference between the phase curve and secondary eclipse was zero or negative, we did not calculate a nightside temperature. When the derived error bounds for some of the candidates included zero, we did not give a lower limit for the nightside temperature.
Furthermore, we calculated the geometric albedo using:
which assumes no contribution from thermal emission.
Correcting for thermal emission we used (see Heng & Demory 2013):
where
with
Assuming a Lambertian criterion [Ab = (3/2)Ag ], we calculated the equilibrium temperature using
The resulting albedos corrected for thermal emission for no redistribution, , and fully efficient redistribution,
, of heat from planetary day to nightside are shown in Table 5.
Cases where our derived nightside temperatures resulted in upper limits indicate that the error in the nightside flux was as large as the nightside flux itself.
2.5. Phase Shift Due to Clouds
For three of our targets (Kepler 7b, 12b, and 43b), the fits using the phase-curve model above were not sufficient and a clear systematic offset was seen in the residuals. A quick literature search for these targets from our sample showed that this effect can be explained by a shift of the reflection signal, due to the super-rotation phenomenon (Demory et al. 2013; Heng & Demory 2013). In order to also model this higher order effect for these few exceptional systems, we added a component to the model light curve for (only) these three targets. This shift in the phase curve caused by planetary clouds (Demory et al. 2013) for Kepler 7b, 12b and 43b was modeled in a similar fashion to the phase curve itself, where we added an additional free parameter ϕshift to describe the phase shift:
Using this model to modify Fp (updating equation [8] with equation [22]), we found significant phase shifts ϕshift for KOI-20.01, KOI-97.01, and KOI-135.01 (see § 3.1.7, 3.1.8, and 3.1.10).
2.6. Upper Limits
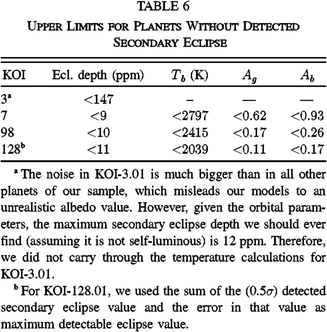
For some of the planets in our sample, we did not detect a secondary eclipse and/or a phase curve. In these cases, we were only able to give upper limits for the derived parameters (see § 3.2). In other cases, our fits only constrained a limited number of parameters. For the planets in our sample for which the model does not fit a significant secondary eclipse, the upper limits for the secondary eclipse depths were calculated by adding the 1 sigma errors from the covariance matrix to the best-fit values. The same was applied and propagated for the then derived albedo and brightness temperature limits of these candidates (see § 3.2).
3. Results
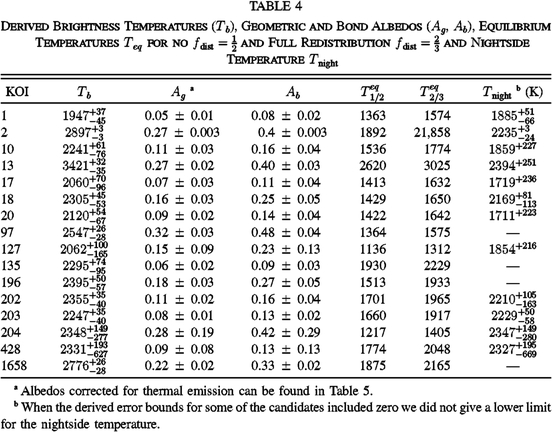
Our results are summarized in Tables 3–pasp_127_957_1113tb4 pasp_127_957_1113tb5 6. Figures 1–5 illustrate our fitting efforts. In the following sections, we report individually on all our analyzed targets and, where possible, compare to previous observations and measurements.
|
|
|
3.1. Detected Secondary Eclipses
3.1.1. KOI 1.01/TrES-2b/Kepler 1b
TrES-2b (or KOI 1.01, Kepler-1b)—a 1.28 MJup and 1.24 RJup planet on a 2.47 day orbit around a G0V star (O’Donovan et al. 2006)—was the first planet detected in the Kepler field. Kipping & Spiegel (2011) determine a day–night contrast amplitude of 6.5 ± 1.9 ppm which corresponds to a geometric albedo of Ag
= 0.025 ± 0.007 and found a nonsignificant eclipse with depth of 16 ± 13 ppm, similar to Kipping & Bakos (2011), who derived a value of 21 ± 22. Demory & Seager (2011) found a geometric albedo of 0.06 ± 0.05 and an equilibrium temperature of 1464 K using only Q1 data. Barclay et al. (2012) derived a phase curve with ellipsoidal variations and Doppler beaming of amplitudes and
), respectively, and a difference between the day and nightside planetary flux of
. They found a geometric albedo of
and a secondary eclipse depth of
. Barclay et al. (2012) also showed that an atmosphere model that contains a temperature inversion is strongly preferred and suggested that the Kepler bandpass probes a significantly greater atmospheric depth on the nightside. The analysis of Esteves et al. (2013) for TrES-2b shows an eclipse depth of 7.5 ± 1.7 ppm, a brightness temperature Tb
of
a very low geometric albedo Ag
of 0.03 ± 0.001 and a nightside temperature Tnight of 1700 K. For KOI-1.01, Coughlin & López-Morales (2012) measure an eclipse depth of -9.3 ± 14.2 ppm and report a maximum albedo of
and brightness temperature of
.
3
Our fit for KOI-1.01 shows an eclipse depth of 10.9 ± 2.3 ppm, a brightness temperature Tb
of a geometric albedo Ag
of 0.05 ± 0.01 a bond albedo Ab
of 0.08 ± 0.02, leading to an upper limit for the nightside temperature Tnight of
. These results agree very well with and therefore confirm the aforementioned measurements. Figure 1 (top left) shows our fit results for KOI-1.01.
3.1.2. KOI 2.01/HAT-P-7b/Kepler 2b
HAT-P-7b is a 1.78 MJup and 1.36 RJup planet on a 2.204 orbit around an evolved F6 star (Pál et al. 2008). Due to its bright host star and its detection before the launch of the Kepler mission, it is one of the best studied planets in our sample. A number of other groups already analyzed the secondary eclipse of this target using different methods with results spanning from 67 up to 130 ppm. From the first 10 days of Kepler calibration data, Borucki et al. (2009) derived an eclipse depth of 130 ± 11 ppm percent in the Kepler band. Using the whole first quartile Q1 data, Demory & Seager (2011) derived a geometric albedo of 0.20 ± 0.1 and an equilibrium temperature of 2085 K . Esteves et al. (2013) measure an eclipse depth of 68.31 ± 0.69 ppm, a brightness temperature Tb
of a geometric albedo Ag
of 0.196 ± 0.002 and an upper limit for the nightside temperature Tnight of 1950 K for HAT-P-7. For KOI-2.01, Coughlin & López-Morales (2012) measure an eclipse depth of 57.7 ± 9.30 ppm and report a maximum albedo of
and brightness temperature of
.
For KOI-2.01, we find an eclipse depth of 69.3 ± 0.6 ppm, corresponding to a brightness temperature Tb
of , a geometric albedo Ag
of 0.27 ± 0.01 and a bond albedo Ab
of 0.4 ± 0.01. The resulting upper limit for the nightside temperature Tnight is
. Here again we are mostly in agreement with the other analyses from the literature. Figure 1 (top right) shows our fit results for KOI-2.01.
3.1.3. KOI 10.01/Kepler 8b
Kepler 8b, with a radius of 1.41 RJup and a mass of 0.60 MJup, is among the lowest density planets () known. It orbits a relatively faint (V = 13.89 mag) F8IV subgiant host star with a period of P = 3.523 d and a semimajor axis of
AU (Jenkins et al. 2010). Kipping & Bakos (2011) exclude secondary eclipses of depth 101.5 ppm or greater to 3-σ confidence, which excludes a geometric albedo >0.63 to the same level. Demory & Seager (2011) report a geometric albedo of 0.21 ± 0.1 and an equilibrium temperature of 1567 K using only Q1 data. For Kepler 8b, Esteves et al. (2013) derive an eclipse depth of 26.2 ± 5.6 ppm, a brightness temperature Tb
of
, a geometric albedo Ag
of 0.134 ± 0.03, and an upper limit for the nightside temperature Tnight of 2100 K. For KOI-10.01, Coughlin & López-Morales (2012) measure an eclipse depth of -5.8 ± 45.9 ppm and report a maximum albedo of
and brightness temperature of
.
In our fits of KOI-10.01, we find an eclipse depth of 16.5 ± 4.45 ppm, a brightness temperature Tb
of , a geometric albedo Ag
of 0.11 ± 0.03, a bond albedo Ab
of 0.16 ± 0.04, and an upper limit for the nightside temperature Tnight of 1859+227 K. Our results are slightly lower, however, consistent with Esteves et al. (2013). Figure 1 (bottom left) shows our fit results for Kepler 8b.
3.1.4. KOI 13.01/Kepler 13b
Kepler 13 (or KOI 13.01) is the second brightest host star in our sample with mag 9.958 in the Kepler band. The planet Kepler 13b was detected by Shporer et al. (2011) due to its photometric orbit using the BEER algorithm (Faigler & Mazeh 2011). KOI-13.01 is a super-Jovian planet with a mass of 8.3 MJup and 1.4 RJup radius on a 1.76 day orbit around a A5-7V host star (Mislis & Hodgkin 2012). Santerne et al. (2012) found that the transiting planet is orbiting the main component of a hierarchical triple system of two fast rotating a stars and one more companion with mass between 0.4 and 1 MSun. Szabó et al. (2012) reported a spin-orbit resonance, transit duration variation, and possible secular perturbations in the KOI-13 system. For KOI-13.01, Esteves et al. (2013) measure an eclipse depth of 143.0 ± 1.2 ppm, a brightness temperature Tb
of , a geometric albedo Ag
of 0.42 ± 0.0031, and an upper limit for the nightside temperature Tnight of 2710. For KOI-13.01, Coughlin & López-Morales (2012) measure an eclipse depth of 88.8 ± 6.19 ppm and report a maximum albedo of
and brightness temperature of
.
For Kepler 13b, we find an eclipse depth of 84.8 ± 5.4, corresponding to a brightness temperature of , a geometric albedo of 0.27 ± 0.02, a bond albedo of 0.40 ± 0.03, and a nightside temperature of 2394+251. Figure 1 (bottom, right) shows our fit results for Kepler 13b.
Part of the reason for the inconsistency with the Esteves et al. (2013) numbers is the different way the dilution between the two stars in the visual binary was accounted for also the slightly different host star parameters assumed in each paper. Our results compare very well to the numbers of Shporer et al. (2014). However, our fits show a clearly visual offset from the actual data (see 1; bottom, right—slope of the bottom of the secondary eclipse, excess flux prior to secondary). We suspect that the reported low but significant eccentricity of 0.034 ± 0.003 (Placek et al. 2014; Shporer et al. 2014) and gravity-darkening (as shown in Masuda 2015) can explain this effect.
3.1.5. KOI 17.01/Kepler 6b
Kepler 6b (Dunham et al. 2010) is a transiting Hot Jupiter orbiting a 3.8 Gyr old star with unusually high metallicity ([Fe/H] = +0.34 ± 0.04) in a P = 3.235 d orbit. It has a mass of MP
= 0.67 MJup, and a radius of RP
= 1.32 RJup, resulting in a density of 0.35 (g/cm3). The host star Kepler 6 is more massive and larger than the sun (1.21 MSun, 1.39 RSun) but slightly cooler with Ts
= 5724 K. Kipping & Bakos (2011) exclude secondary eclipses of depth 51.5 ppm or greater to 3σ confidence, which excludes a geometric albedo of more than 0.32 to the same level. Désert et al. (2011) found a brightness temperatures of Kepler 6b from Spitzer observations of TB
= 1660 ± 120 K and an optical geometric albedo Ag
in the Kepler bandpass of Ag
= 0.11 ± 0.04. Demory & Seager (2011) derive a geometric albedo of 0.18 ± 0.09 and an equilibrium temperature of 1411 K from Kepler’s Q1 data. For Kepler 6, Esteves et al. (2013) measure an eclipse depth of 8.9 ± 3.8 ppm, a brightness temperature Tb
of , a geometric albedo Ag
of 0.058 ± 0.025, and an upper limit for the nightside temperature Tnight of 1600 K. For KOI-17.01, Coughlin & López-Morales (2012) measure an eclipse depth of -71.7 ± 33.6 ppm and report a maximum albedo of
and brightness temperature of
.
For KOI-17.01, we derive an eclipse depth of 11.3 ± 4.2 ppm, a brightness temperature Tb
of , a geometric albedo Ag
of 0.07 ± 0.03, a bond albedo Ab
of 0.11 ± 0.04, and an upper limit for the nightside temperature Tnight of 1719+236 K, again confirming the results of Esteves et al. (2013). Figure 2 (top left) shows our fit results for Kepler 6b.
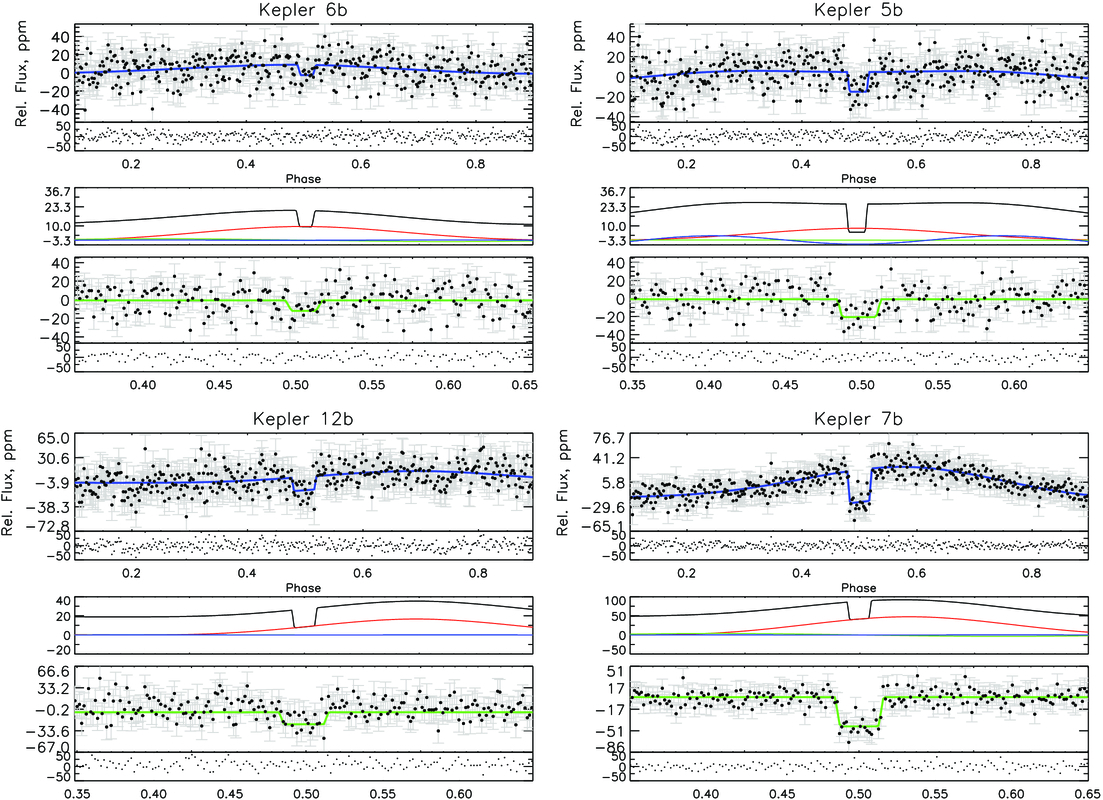
Fig. 2. Fitted light curves for KOI-17.01/Kepler 6b (top left) KOI-18.01/Kepler 5b (top right), KOI-20.01/Kepler 12b (bottom left), and KOI-97.01/Kepler 7b (bottom right). In each quarter: Phase curve, residuals (top). Center: phase-curve contributions: Doppler (blue), ellipsoidal (green), planetary phase (red). Bottom: zoom into phase curve subtracted secondary eclipse, residuals.
3.1.6. KOI 18.01/Kepler 5b
Kepler 5b (or KOI 18.01) is a 2.11 MJup and 1.43 RJup planet on a 3.55 day orbit around a 13th magnitude star (Koch et al. 2010). Kipping & Bakos (2011) detect a weak secondary eclipse for Kepler 5b of depth 25 ± 17 ppm and a geometric albedo of Ag
= 0.15 ± 0.10. Désert et al. (2011) found a brightness temperatures of Kepler 5b from Spitzer observations of TB
= 1930 ± 100 K and an optical geometric albedo in the Kepler band of Ag
= 0.12 ± 0.04. Demory & Seager (2011) report a geometric albedo of 0.21 ± 0.1 and an equilibrium temperature of 1557 K using only Q1 data. For Kepler 5b, Esteves et al. (2013) find an eclipse depth of 18.8 ± 3.7 ppm, a brightness temperature Tb
of , a geometric albedo Ag
of 0.119 ± 0.025, and an upper limit for the nightside temperature Tnight of 2100. For KOI-18.01, Coughlin & López-Morales (2012) measure an eclipse depth of -89.8 ± 48.6 ppm and report a maximum albedo of
and brightness temperature of
.
Our light-curve fits of KOI-18.01 show an eclipse depth of 19.8 ± 3.65 ppm, a brightness temperature Tb
of , a geometric albedo Ag
of 0.16 ± 0.03, a bond albedo Ab
of 0.25 ± 0.05, and a nightside temperature Tnight of
. These results are very close to the values of Esteves et al. (2013). Figure 2 (top right) shows our fit results for KOI-18.01.
3.1.7. KOI 20.01/Kepler 12b
Kepler 12b (KOI 20.01, Fortney et al. 2011), with a radius of 1.69 ± 0.03 RJup and a mass of 0.43 ± 0.04 MJup, belongs to the group of planets with highly inflated radii. On a 4.44 day orbit around a slightly evolved G0 host, Kepler 12b is the least irradiated within the class of inflated and very low-density planets [0.11 ± 0.01(g/cm3)] and may have important implications for the question of the correlation between irradiation and inflation. Fortney et al. (2011) also detected a secondary eclipse depth of 31 ± 7 ppm, corresponding to a geometric albedo of 0.14 ± 0.04. For KOI-20.01, Coughlin & López-Morales (2012) measure an eclipse depth of -26.3 ± 28.5 ppm and report a maximum albedo of and brightness temperature of
.
Our fits of KOI 20.01’s light curve confirm and improve this with a resulting eclipse depth of 18.7 ± 4.9 ppm, a brightness temperature Tb
of , a geometric albedo Ag
of 0.09 ± 0.02, a bond albedo Ab
of 0.14 ± 0.04, and an upper limit for the nightside temperature Tnight of 1711+223 K. Furthermore, we found a phase shifts ϕshift of -0.19 ± 0.03 for KOI 20.01. Figure 2 (bottom left) shows our fit results for Kepler 12b.
3.1.8. KOI 97.01/Kepler 7b
Kepler 7b (Latham et al. 2010) with a mass of 0.43 MJup and radius 1.48 RJup also has a very low density of 0.17(g/cm3). For KOI-97.01, Coughlin & López-Morales (2012) measure an eclipse depth of 79.1 ± 15.3 ppm and report a maximum albedo of and brightness temperature of
. Demory et al. (2011), using Q0-Q4 data, measure an occultation depth in the Kepler bandpass of 44 ± 5 ppm, a geometric albedo of 0.32 ± 0.03, and a planetary orbital phase light curve with an amplitude of 42 ± 4 ppm.
Our results for KOI-97.01 confirm this almost exactly: we find an eclipse depth of 46.6 ± 4.0 ppm, a brightness temperature Tb
of , a geometric albedo Ag
of 0.32 ± 0.03, and a bond albedo Ab
of 0.48 ± 0.04. We also detected an additionally phase shifts ϕshift of -0.08 ± 0.02 for KOI-97.01. Figure 2 (bottom left) shows our fit results for Kepler 12b. It is interesting to see that the error values for Demory et al. (2011) are almost exactly the same, even though they only used Q0-4 in comparison to Q0-15 in our study. One possible explanation could be that Demory et al. (2011) did not include Doppler or ellipsoidal components in their model or maybe these results hint at a systematic noise floor we are reaching here.
We also confirm the following results: Kipping & Bakos (2011) detect a secondary eclipse for Kepler 7b of depth 47 ± 14 ppm and a geometric albedo of Ag = 0.38 ± 0.12. The day–night difference of 17 ± 9 ppm they calculate supports the hypothesis of thermal emission as a source for both the secondary eclipse and the phase curve. Demory & Seager (2011) find a geometric albedo of 0.35 ± 0.11 and an equilibrium temperature of 1370 K using only data from the first quartile.
3.1.9. KOI 127.01/Kepler 77b
Kepler 77b (Gandolfi et al. 2013) is a moderately bloated planet with a mass of MP
= 0.430 ± 0.032 MJup, a radius of RP
= 0.960 ± 0.016 RJup, orbiting) G5 V star with a period of 3.58 days. Gandolfi et al. (2013) do not find a secondary eclipse with a depth larger than 10 ppm which leads to limits of the geometric and Bond albedo of Ag
≤ 0.087 ± 0.008 and Ab
≤ 0.058 ± 0.006, respectively. For KOI-127.01, Coughlin & López-Morales (2012) measure an eclipse depth of -92.6 ± 39.1 ppm and report a maximum albedo of and brightness temperature of
.
For KOI-127.01, we find an eclipse depth of 13.3 ± 7.4 ppm, which results in a brightness temperature of , geometric albedo of 0.15 ± 0.09, bond albedo of 0.23 ± 0.13, and nightside temperature of 1854+216 K. Figure 3 (top left) shows our fit results for Kepler 77b.
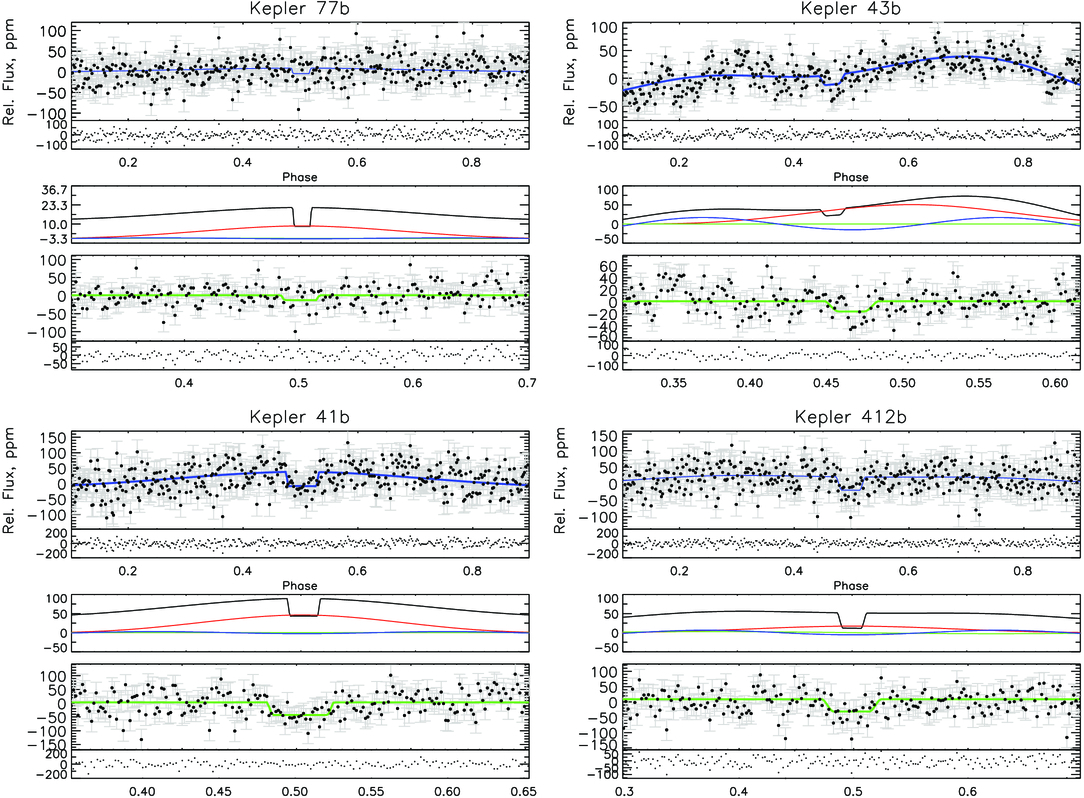
Fig. 3. Fitted lightcurves for KOI-127.01/Kepler 77b (top left), KOI-135.01/Kepler 43b (top right), KOI-196.01/Kepler 41b (bottom left), and KOI-202.01/Kepler 412b (bottom right). In each quarter: Phase curve, residuals (top). Center: phase-curve contributions: Doppler (blue), ellipsoidal (green), planetary phase (red). Bottom: zoom into phase curve subtracted secondary eclipse, residuals.
3.1.10. KOI 135.01/Kepler 43b
KOI-135.01 (Bonomo et al. 2012) with radius RP
= 1.20 ± 0.06 RJup and mass MP
= 3.23 ± 0.19 MJup orbits its parent star in 3.02 days. We are the first to report a secondary eclipse of KOI-135.01 with a depth of 17.0 ± 5.3 ppm. This corresponds to a brightness temperature Tb
of , a very low geometric albedo Ag
of 0.06 ± 0.02 and a bond albedo Ab
of 0.09 ± 0.03, respectively. Using our model, we also found a phase shift ϕshift of -0.10 ± 0.01 for KOI-135.01. Figure 3 (top right) shows our fit results for KOI-135.01.
3.1.11. KOI 196.01/Kepler 41b
The planet KOI-196.01, with a radius of 0.84 ± 0.03 RJup and a mass of 0.49 ± 0.09 MJup, orbits a G2V star of 0.99 ± 0.03 Rsun (Santerne et al. 2011a): KOI-196.01 is one of the rare close-in Hot Jupiters with a radius smaller than Jupiter suggesting a noninflated planet. Santerne et al. (2011a) detect a secondary eclipse depth of 64 ± 10 ppm as well as the optical phase variation, leading to a relatively high geometric albedo of Ag
= 0.3 ± 0.08 and a temperature of TB
= 193 ± 80 K. Quintana et al. (2013) confirmed the Hot Jupiter Kepler 41b via phase-curve analysis and find a secondary eclipse depth of 60 ± 9 ppm and a geometric albedo of Ag
= 0.23 ± 0.05. For KOI-196.01, Coughlin & López-Morales (2012) measure an eclipse depth of 75.4 ± 40.1 ppm and report a maximum albedo of and brightness temperature of
.
For KOI-196.01, we find an eclipse depth of 46.2 ± 8.7 ppm, slightly lower than, but however consistent with Quintana et al. (2013) and Santerne et al. (2011a). Our fits correspond to a brightness temperature Tb
of , a geometric albedo Ag
of 0.18 ± 0.03, and a bond albedo Ab
of 0.27 ± 0.05. Figure 3 (bottom left) shows our fit results for KOI-196.01.
3.1.12. KOI 202.01/Kepler 412b
The planet Kepler 412b (Deleuil et al. 2014) is an inflated Jupiter with a mass of 0.94 ± 0.09 MJup and a radius of 1.33 ± 0.04 RJup orbiting its G3 V host star in 1.72 days. Deleuil et al. (2014) detected a secondary eclipse 47.4 ± 7.4 ppm and derived the dayside temperature to be a maximum of 2380 ± 40 K and estimated the geometrical albedo, Ag
, in the range 0.09–0.13 and a nightside temperature of 2154 ± 83 K. For KOI-202.01, Coughlin & López-Morales (2012) measure an eclipse depth of 63.6 ± 37.7 ppm and report a maximum albedo of and brightness temperature of
. Figure 3 (bottom right) shows our fit results for Kepler 412b. Our analysis of Kepler 412b shows an eclipse depth of 40.2 ± 9.0 ppm, well within the lower end of the value of Deleuil et al. (2014). We therefore get a brightness temperature of
, geometric albedo of 0.11 ± 0.02, bond albedo of 0.16 ± 0.04, and a nightside temperature of
.
3.1.13. KOI 203.01/Kepler 17b
Kepler 17b is a MP
= 2.45 ± 0.11 MJup and RP
= 1.31 ± 0.02 RJup planet orbiting a 1.02 ± 0.03 RSun star with a period of 1.49 days (Endl et al. 2011). Endl et al. (2011) measure an eclipse depth of 58 ± 10 ppm and a geometric albedo Ag
of 0.1 ± 0.02. Bonomo et al. (2012) find a slightly different Mp
= 2.47 ± 0.10 MJup and Rp
= 1.33 ± 0.04 RJup and an upper limit for the geometric albedo of Ag
< 0.12. For KOI-203.01, Coughlin & López-Morales (2012) measure an eclipse depth of 52. ± 98.0 ppm and report a maximum albedo of and brightness temperature of
.
For KOI-203.01, we find an eclipse depth of 43.7 ± 6.4 ppm, a brightness temperature Tb
of , a geometric albedo Ag
of 0.08 ± 0.01, a bond albedo Ab
of 0.13 ± 0.02, and an upper limit for the nightside temperature Tnight of
. These results are slightly different from, but still consistent with Bonomo et al. (2012) and Endl et al. (2011). Figure 4 (top left) shows our fit results for KOI 203.01.
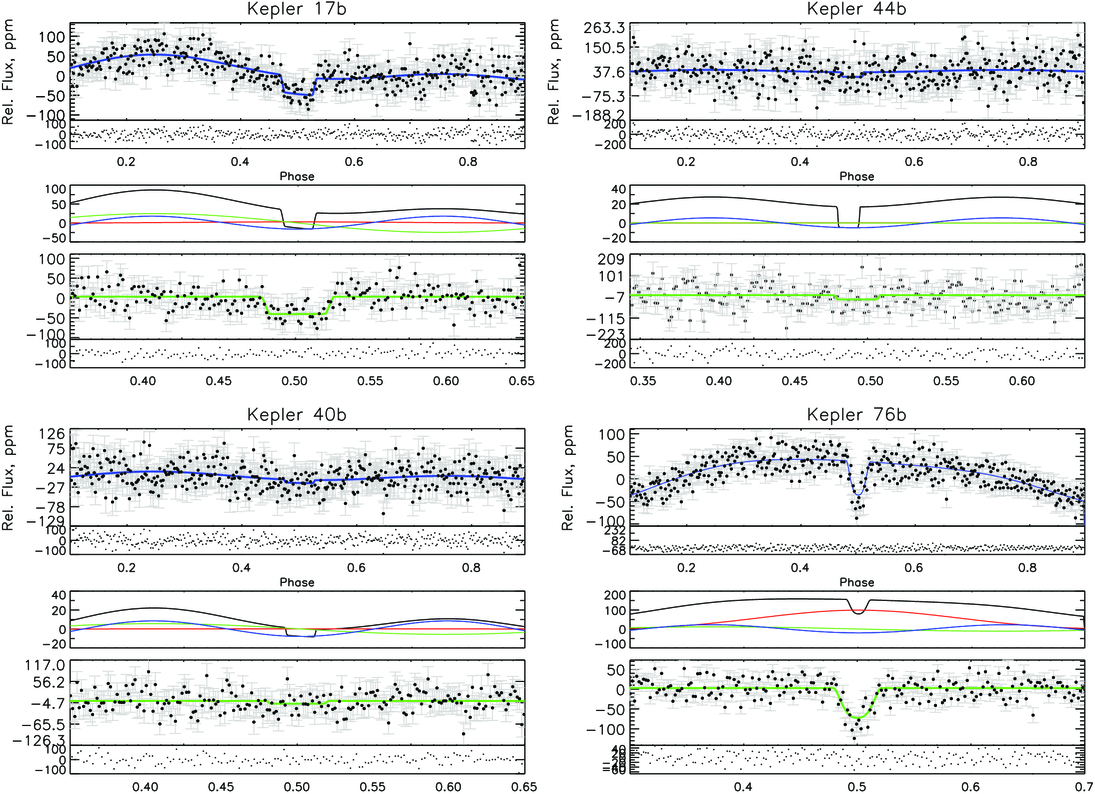
Fig. 4. Fitted light curves for KOI-203.01/Kepler 17b (top left) KOI-204.01/Kepler 44b (top right), KOI-428.01/Kepler 40b (bottom left), and KOI-1658.01/Kepler 76b (bottom right). In each quarter: Phase curve, residuals (top). Center: phase-curve contributions: Doppler (blue), ellipsoidal (green), planetary phase (red). Bottom: zoom into phase curve subtracted secondary eclipse, residuals.
3.1.14. KOI 204.01/Kepler 44b
KOI-204.01 (Bonomo et al. 2012) is a 1.24 ± 0.07 RJup, 1.02 ± 0.07 MJup planet orbiting its parent G2IV star in 3.25 days. For KOI-204.01, Coughlin & López-Morales (2012) measure an eclipse depth of 54.8 ± 82.5 ppm and report a maximum albedo of and brightness temperature of
.
For KOI-204.01, we marginally detect a secondary eclipse with a depth of 21.9 ± 14.9 ppm. This corresponds to a brightness temperature Tb
of a geometric albedo Ag
of 0.28 ± 0.19, a bond albedo Ab
of 0.42 ± 0.29, and an upper limit for the nightside temperature Tnight of
. Figure 4 (top right) shows our fit results for KOI 204.01.
3.1.15. KOI 428.01/Kepler 40b
The planet KOI-428.01 (1.17 ± 0.04 RJup; 2.2 ± 0.4 MJup), orbits an F5IV star of 2.13 ± 0.06 RSun, 1.48 ± 0.06 MSun, one of the largest and the most evolved stars discovered so far with a transiting planet (Santerne et al. 2011b).
For KOI-428.01, we detect an eclipse depth of 7.91 ± 7.55 ppm, consistent with a nondetection within 1σ. This corresponds to limits for the brightness temperature Tb
of , the geometric albedo Ag
of 0.09 ± 0.08, the bond albedo Ab
of 0.13 ± 0.13, and an upper limit for the nightside temperature Tnight of
. Figure 4 (bottom left) shows our fit results for KOI 428.01.
3.1.16. KOI 1658.01/Kepler 76b
Kepler 76b (Faigler et al. 2013) (2.0 ± 0.26 MJup, 1.25 ± 0.08 RJup) orbits a 1.2 MSun star in 1.55 days. It is slightly denser than Jupiter indicating that it is not inflated like other planets in this sample. Faigler et al. (2013) find a secondary eclipse depth of 98.9 ± 7.1 ppm as well as significant contribution to Doppler, elipsoidal, and phase modulations of 13.5, 21.1 and 50.4 ppm.
For Kepler 76b, our model fits an eclipse of 75.6 ± 5.6 ppm, about 25% less than in Faigler et al. (2013). Using our values, we find a brightness temperature of , a geometric albedo of 0.22 ± 0.02, and bond albedo of 0.33 ± 0.02. Figure 4 (bottom right) shows our fit results for KOI 1658.01. We find a Doppler boosting of 11.4 ± 1.0 and a ellipsoidal variation of 22.6 ± 1.9, well in agreement with Faigler et al. (2013). However, our derived phase-curve amplitude of 101.3 ± 3.6 is a factor two bigger than theirs. Reasons for this discrepancy—also in the derived eclipse depth—could be third-light contributions (f3 = 0.056, average third-light fraction used in Faigler et al. [2013]) or different stellar parameters (we used their TODMOR derived values from Table 2 in Faigler et al. [2013], whereas they fitted to the values in Table 1).
3.2. Nondetections
For the following planets from our sample, we were not able to detect secondary eclipses. The upper limits for secondary eclipse depths, albedos, and brightness temperatures of these candidates were calculated by adding the 1σ errors from the covariance matrix to the best-fit values.
3.2.1. KOI 3.01/HAT-P-11b/Kepler 3b
HAT-P-11b (KOI 3.01 or Kepler 3b, Bakos et al. 2010) is a Hot Neptune-type planet (17 Me , 3.8 Re ) orbiting a bright (V = 9.59) and metal-rich K4 dwarf star with a period of 4.89 days. This planet that was already detected before the start of the Kepler mission is the brightest in our sample and the whole Kepler catalog with a magnitude of 9.174 in the Kepler band. Several other groups already analyzed the phase curves with no detection of a secondary eclipse (e.g., Southworth 2011; Deming et al. 2011; Sanchis-Ojeda & Winn 2011). Figure 5 (top left) shows our fit results for KOI 3.01.
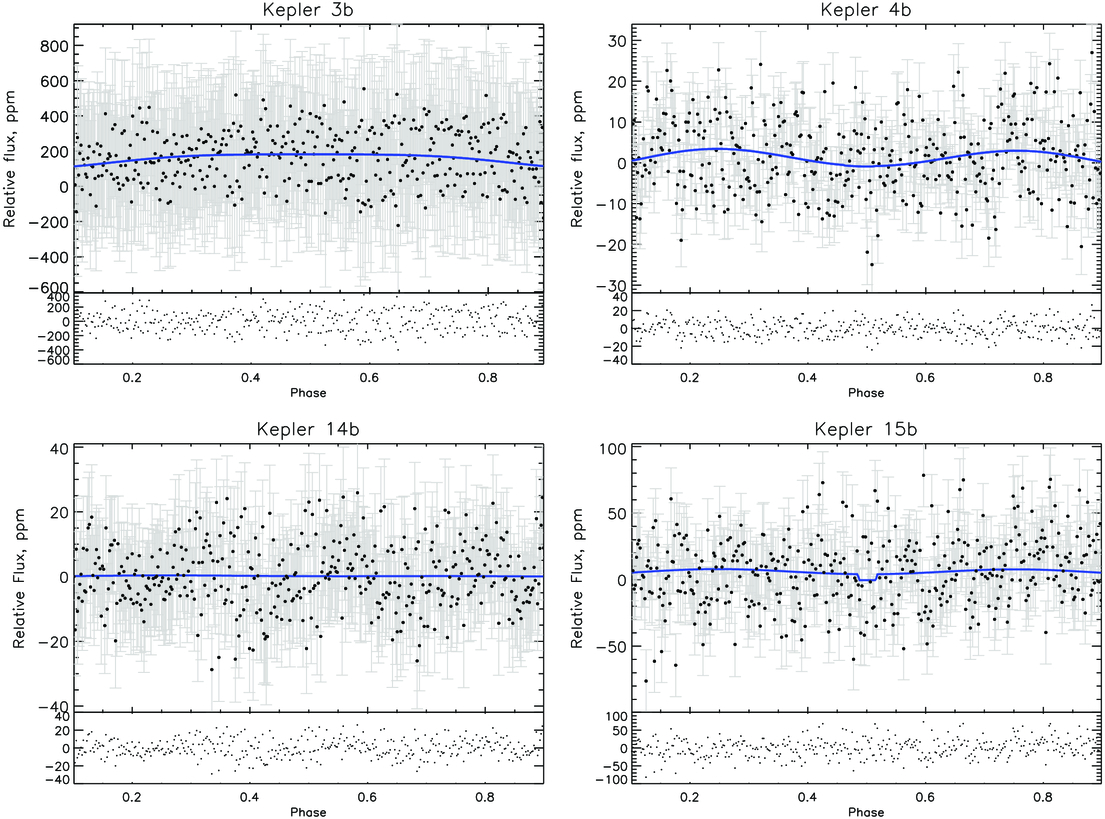
Fig. 5. Fitted light curves for KOI-3.01/HAT-P-11b/Kepler 3b (top left) KOI-7.01/Kepler 4b (top right), KOI-98.01/Kepler 14b (bottom left), and KOI-128.01/Kepler 15b (bottom right). Blue curves are the best-fit model. None of these systems showed a significant secondary eclipse larger than our noise threshold. However, we were able to calculate upper limits for some of the parameters of these systems (see Table 6).
The noise in KOI-3.01 is much bigger than in all other planets of our sample, which misleads our models to an unrealistic albedo value. However, given the orbital parameters, the maximum secondary eclipse depth we should ever find (assuming it is not self-luminous) is 12 ppm. Therefore, we did not carry through the temperature calculations for KOI-3.01.
3.2.2. KOI 7.01/Kepler 4b
Kepler 4b (or KOI 7.01; Borucki et al. [2010a]) is a 24.5 ± 3.8 Me and 3.99 ± 0.21 Re planet with a period of 3.21 days around a 4.5 Gyr old near-turnoff G0 star. With a density of about 1.9 g/cm3, Kepler 4b is slightly denser and more massive than Neptune, but about the same size. Kipping & Bakos (2011) exclude a secondary eclipse with an upper limit of 104 ppm for its depth, which corresponds to an upper limit for the brightness temperature of 3988 K.
Our analysis confirms this and is also consistent with a nondetection to a level of < 9 ppm, which enables us to constrain the brightness temperature Tb to < 2797 K. Figure 5 (top right) and Table 6 show our fit results for KOI 7.01.
3.2.3. KOI 98.01/Kepler 14b
Kepler 14b (or KOI 98.01) is a 8.40 MJup and 1.136 RJup planet on a 6.79 day orbit around an F star in a binary system (Buchhave et al. 2011). Our analysis, which used an additional polynomial fit to correct for systematics caused by a close visual binary, is the first of this kind for KOI-98.01. The results show an eclipse depth consistent with a nondetection of < 10 ppm. This leads to a brightness temperature limit Tb < 2415 K, a geometric albedo Ag < 0.17. Figure 5 (bottom left) and Table 5 show our fit results for KOI 98.01.
3.2.4. KOI 128.01/Kepler 15b
Kepler 15b (Endl et al. 2011) is a 0.66 ± 0.1 MJup, 0.96 ± 0.06 RJup planet in 4.94 day orbit around a metal-rich ([Fe/H] = 0.36 ± 0.07) G star; its mean density of 0.9 ± 0.2 g/cm3 suggests a significant enrichment in heavy elements. Endl et al. (2011) find no sign of a secondary eclipse.
For KOI-128.01, we find an eclipse depth consistent with a nondetection of < 11 ppm. This corresponds to a brightness temperature Tb limit of < 2039 K and a geometric albedo limit Ag of < 0.11. Figure 5 (bottom right) and Table 6 show our fit results for KOI 128.01. For KOI-128.01, we used the sum of the (0.5σ) detected secondary eclipse value and the error in that value as maximum detectable eclipse value.
3.3. Excluded Planets
We also excluded planets from our sample that are part of multiple systems (e.g., Rowe et al. 2014), circumbinary planets (e.g., Doyle et al. 2011), and highly variable host star systems. Excluded multiple systems containing planets that fall into our sample are KOI 46/Kepler 10, KOI 137/Kepler 18, KOI 338/Kepler 141, KOI 1779/Kepler 318 and KOI 1805/Kepler 319. We excluded KOI 63.01/Kepler 63b (Sanchis-Ojeda et al. 2013) from our sample because we were not able to apply our methods. In this case, the light curve was dominated by contributions from an additional signal with a different periodicity most probably induced by stellar activity.
3.4. The Case of KOI 200/Kepler 74b and KOI-2133/Kepler 91b
The planet Kepler 74b (Hébrard et al. 2013) has mass and radius of 0.68 ± 0.09 MJup and 1.32 ± 0.14 RJup and orbits its F8V host star in 7.34 days. Kepler 91b (Lillo-Box et al. 2014) (,
) orbits its host star (R∗ = 6.30 ± 0.16 RSun , M∗ = 1.31 ± 0.10 MSun) only
away from the stellar atmosphere at the pericenter. Lillo-Box et al. (2014) argue that Kepler 91b could therefore be at a stage of the planet engulfment and estimate that Kepler 91b will be swallowed by its host star in less than 55 Myr. They derive phase curve parameters Ae
= 121 ± 33 ppm, Ap
= 25 ± 15 ppm, and Ad
= 3 ± 1 ppm and no clear secondary eclipse, but three other dips in the lightcurve.
Our analysis method (see blue fits in Fig. 6) was not able to recover the signals from these light curves accurately. The reason is that both planets do not show a typical secondary eclipse signature, but instead also a series of extra dimmings at times other than that of the expected eclipse (see gray Fig. 6). The timing of some of these extra dips in the light curve at 0.166 of the period after transit and/or eclipse may be evidence for the presence of Trojan satellites—however, as also stated in Lillo-Box et al. (2014), this claim needs detailed stability studies to be confirmed. Another explanation is correlated noise and/or stellar activity dominating these light curves. We were not able to recover any useful results for the secondary eclipse depths and most of the other phase-curve parameters and therefore were not able to compare to previous results and excluded these two targets from our analysis.
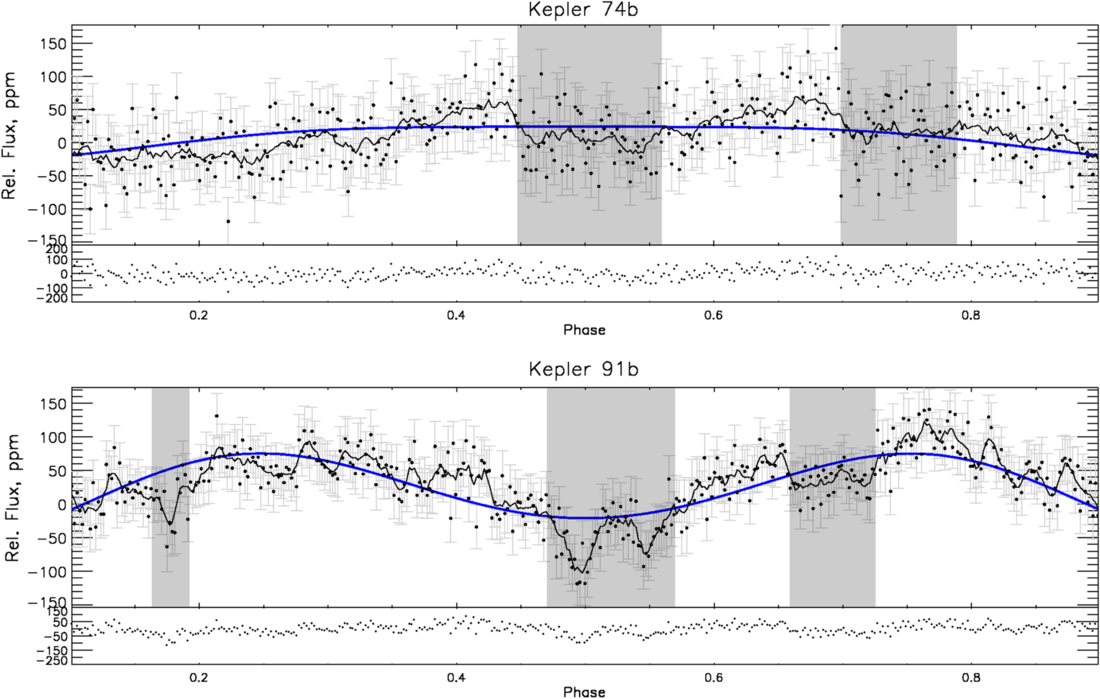
Fig. 6. Light curves of the systems KOI-200/Kepler 74b (top) and KOI-2133/Kepler 91b (bottom). The gray regions of the light curves show extra dimmings that are not explainable with just a secondary eclipse. Our analysis method (blue fits) was not able to recover the secondary eclipse signals from these “noisy” light curves accurately.
4. Summary And Discussion
With our consistent analysis, we were able to confirm and in most cases improve parameters derived by previous studies. We present new results for Kepler 1b-8b, 12b-15b, 17b, 40b, 41b, 43b, 44b, 76b, 77b, and 412b.
4.1. Comparison to Other Fitting Routines: Future Improvements
For the cases of previously analyzed targets, we were able to confirm (within less than 2σ for almost all cases) results derived from various previous or parallel analyses that used very different modeling approaches, from relatively simple boxcar fits (without a phase-curve model) of only the secondary eclipse to very sophisticated Bayesian codes fitting all system parameters in an integrated way. The fact that we reproduce most of these results demonstrates the value of our compromise approach to combine a state-of-the-art phase-curve model including all important contributions with a robust least-squares fit to trade off between number of systems and computing time. Also, our goal was to focus on eclipses and phase curves while fixing all other parameters to previously derived values. This significantly reduces the number of potential degeneracies that usually call for these more elaborated methods.
However, in order to increase the statistical relevance of our results, we are currently working to extend the analysis to the whole sample of 489 Kepler objects of interest with Rp > 4 Re , P < 10 d, Vmag < 15; we plan to apply EXONEST (Placek et al. 2014), a Bayesian model selection algorithm to the whole set of 489 candidates. With a sample of that size we hope to find statistically significant correlations of stellar and planetary parameters with the position of the planet, e.g., in albedo versus incoming flux phase space (see Fig. 7).
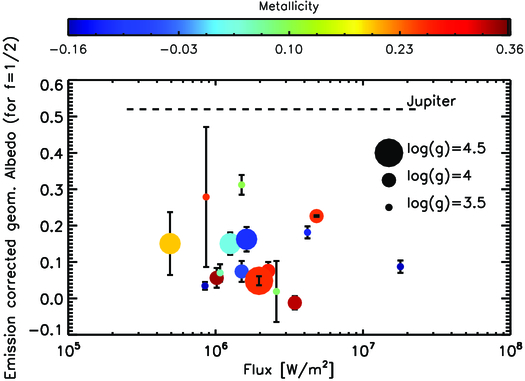
Fig. 7. Emission-corrected geometric albedo Ag,c for (f = 1/2) versus the incident stellar flux for our sample of Kepler giant planets (compare to Fig. 1 in Heng & Demory [2013]). The colors represent the host star’s metallicity [Fe/H] (see color bar) and the size of the symbol corresponds to the host’s surface gravity log(g) (see legend). There is no obvious correlation with the distribution. The dashed line represents Jupiters’s albedo of 0.52 for comparison; all of the Hot Jupiters in our study have lower albedos.
4.2. Correlations with System Parameters
For the following analysis of a potential correlation of the albedo with stellar or planetary parameters (see, e.g., Fig. 7), we used the albedo values, that were corrected for thermal emission (assuming no redistribution; fdist = 1/2) that are shown in Table 5 (center). Our results confirm the general trend of relatively low albedos for most of the Hot Jupiters, but we also show outliers with higher albedos.
We see no significant correlations in our data. Neither the stellar parameters ([Fe/H] and log(g), see Fig. 7) nor the planetary characteristics (mass, radius, density, and surface gravity) correlate with the derived parameters. When excluding the planets with large errors in the albedo, there are indications that massive planets, very dense, and very bloated planets tend to be low in albedo—i.e., density extremes produce low albedos.
Even though we present a relatively large sample characterized in this comprehensive and consistent manner, our sample size is still too small to draw significant statistical conclusions. Future efforts will include analyzing all of the candidates as well as the complete Kepler dataset of 18 available quarters (Q0–Q17).
With TESS (Ricker et al. 2010) and PLATO (Rauer et al. 2014; Hippke & Angerhausen 2015b) on the horizon the future will bear an even bigger data set, marking great potential for characterizations in a similar way. Such future observations and analyses will include many more planets in a similar range of planetary and stellar parameters. A comparative analysis beyond their basic parameters of a large number of planets orbiting a variety of host stars will probe and eventually solve the fundamental underlying questions on planet formation, migration, and composition.
We want to thank Martin Still (Director of the Kepler Guest Observer Office) for his valuable comments and frequent support on the use of PyKE. We thank Avi Shporer, Kevin Heng, and the anonymous referee for valuable comments on the manuscript.
This research was supported by internal funds at the Rensselaer Polytechnic Institute. DA’s research was also supported by an appointment to the NASA Postdoctoral Program at the Goddard Space Flight Center, administered by Oak Ridge Associated Universities through a contract with NASA.
Facilities: Kepler.
Footnotes
- 1
The data presented in this article were obtained from the Mikulski Archive for Space Telescopes (MAST), which is managed by the Space Telescope Science Institute (STScI). STScI is operated by the Association of Universities for Research in Astronomy, Inc., under NASA contract NAS5-26555. Support for MAST for non-HST data is provided by the NASA Science Mission Directorate via grant NNX13AC07G and by other grants and contracts. This paper includes data collected by the Kepler mission. Funding for the Kepler mission is also provided by the NASA Science Mission Directorate.
- 2
http://exoplanetarchive.ipac.caltech.edu/, August 2015.
- 3
When we cite values from Coughlin & López-Morales (2012) we use the results for their method 8—“CLM Light Curve with Eccentricity Free and Stellar Parameters from from Isochrones”—from the supplement materials of their paper.